Every fiber optic network tells a story. The question is whether you know what that story says before something goes wrong. Fiber characterization testing gives network owners and operators a complete picture of their infrastructure's health. It reveals hidden problems, confirms upgrade readiness, and creates the documentation needed for confident decision-making. For telecommunications companies, utilities, and enterprises that depend on fiber connectivity, this testing is not optional. It is essential.
What Is Fiber Characterization?
Fiber characterization is a suite of tests that measures the performance and physical condition of fiber optic cables and connections. Think of it as a comprehensive health checkup for your network's backbone. These tests go beyond simple pass/fail checks. They deliver detailed measurements about signal loss, reflection points, dispersion characteristics, and the exact location of every splice, connector, and potential problem along a fiber route. The goal is straightforward: confirm that your fiber infrastructure can handle the applications you need it to support, both today and as you plan for future upgrades.
According to industry research, network downtime costs organizations more than $300,000 per hour on average. For telecommunications providers and enterprises running critical applications, that figure can exceed $1 million per hour. Fiber characterization helps prevent these costly outages by identifying issues before they cause service disruptions.
Why Fiber Characterization Matters for Your Network
Modern networks demand more from fiber infrastructure than ever before. Data centers are deploying 400G and 800G connections. Telecommunications carriers are expanding 5G backhaul. Utilities are building smart grid communications. Each of these applications requires fiber that meets specific performance thresholds.
Fiber characterization answers critical questions:
- Can your existing fiber support a planned bandwidth upgrade?
- Are there hidden problems that could cause future outages?
- Do your splices and connectors meet industry standards?
- What is the baseline performance for comparison during troubleshooting?
Without this testing, organizations often discover problems at the worst possible time. A data center might install expensive 100G transceivers only to find the fiber cannot support the required link distance.
A carrier might experience intermittent service issues that take weeks to diagnose. These scenarios waste time, money, and customer trust. Proactive fiber audits that include comprehensive characterization testing eliminate these surprises. They provide the data needed to make informed infrastructure decisions.
Core Fiber Characterization Tests
Fiber characterization includes several distinct test types. Each measures different aspects of fiber performance.
OTDR Testing
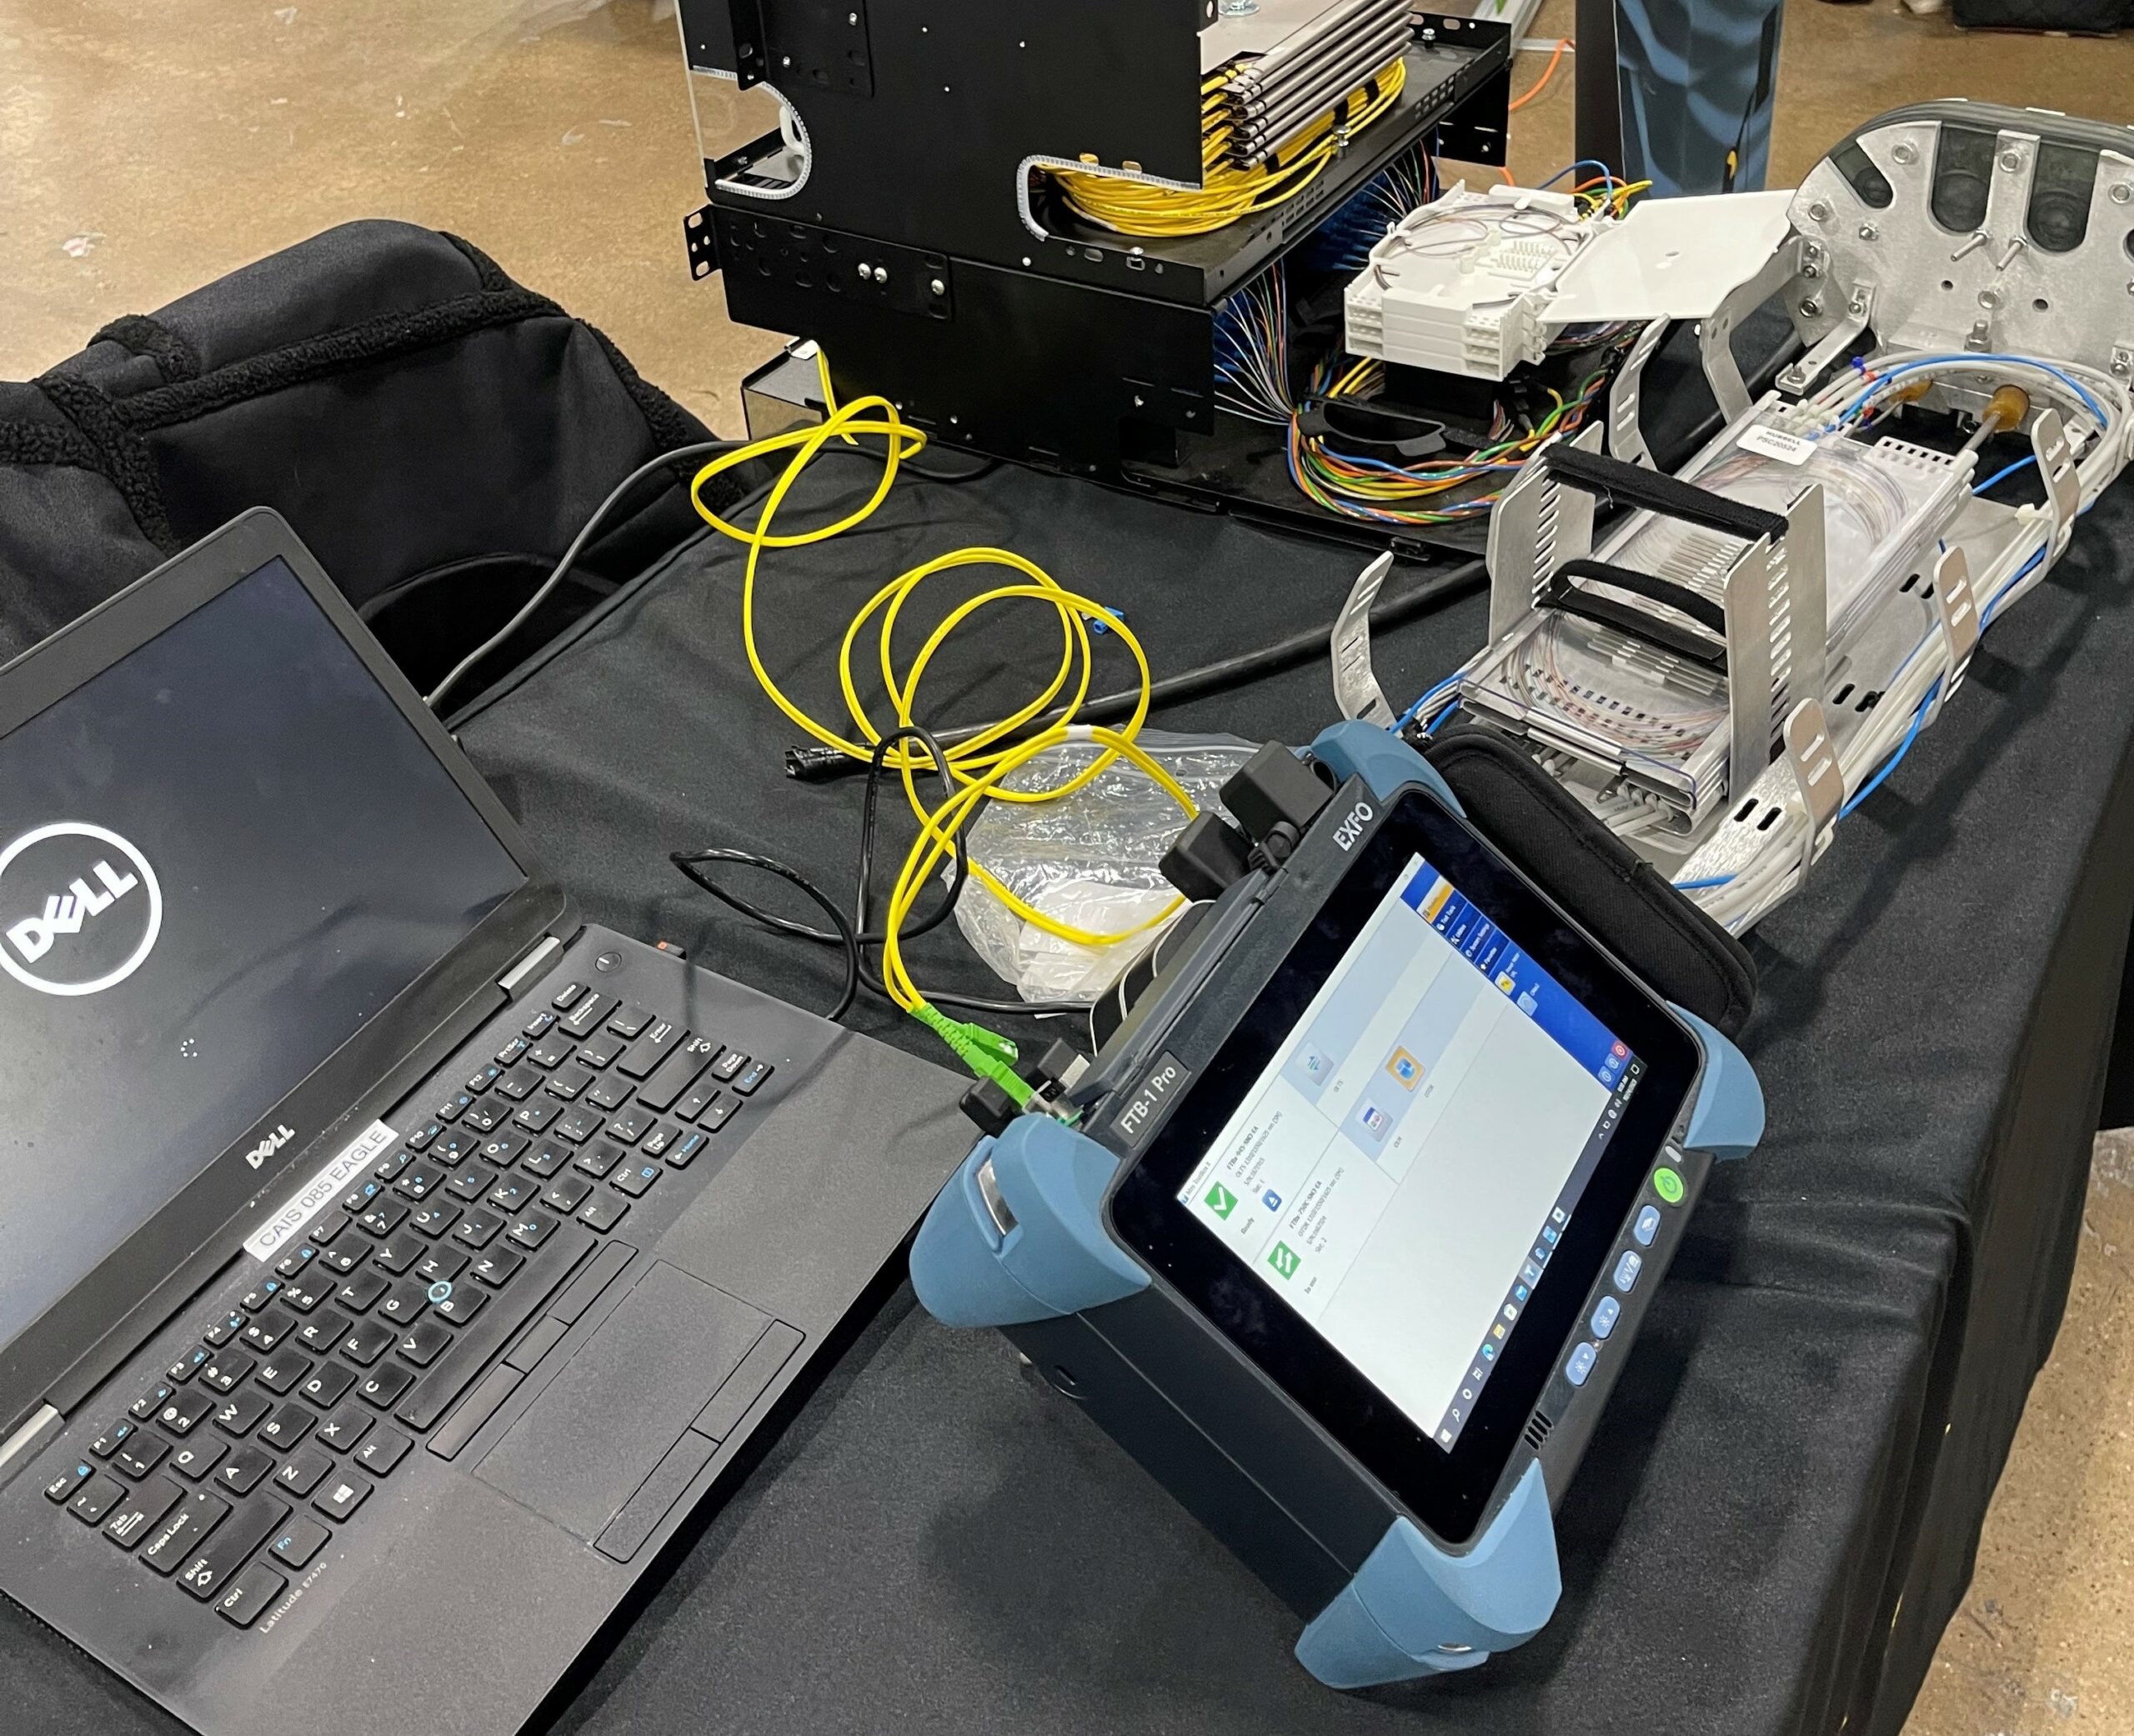
The Optical Time Domain Reflectometer (OTDR) is the workhorse of fiber characterization. It sends light pulses down the fiber and analyzes the reflected signals to create a detailed map of the entire link.
OTDR testing reveals:
- Total fiber length and attenuation profile
- Location and loss of every splice and connector
- Reflectance values at connection points
- Breaks, bends, or damage anywhere along the route
This single-ended test can characterize an entire fiber span from one access point. The resulting trace serves as a permanent record of the fiber's condition at the time of testing.
Insertion Loss and Return Loss
Insertion loss measures how much signal power is lost as light travels through the fiber and its connections. Return loss (also called optical return loss or ORL) measures how much light reflects back toward the source. Both measurements are critical for system performance. Excessive insertion loss reduces signal strength at the receiver. High return loss can destabilize laser transmitters and degrade signal quality.
Chromatic Dispersion Testing
Chromatic dispersion (CD) occurs because different wavelengths of light travel at slightly different speeds through fiber. Over long distances, this causes signal pulses to spread out and overlap. For high-speed networks running 10G, 100G, or faster, chromatic dispersion can limit maximum transmission distance. CD testing measures the actual dispersion characteristics of installed fiber so engineers can design systems that work within those limits.
Polarization Mode Dispersion Testing
Polarization mode dispersion (PMD) happens when the two polarization states of light travel at different speeds due to fiber imperfections or stress. Unlike chromatic dispersion, PMD varies randomly and can cause intermittent problems that are difficult to diagnose. PMD testing is especially important for legacy fiber routes being upgraded to higher speeds. Fiber that worked fine at 2.5G might have PMD levels that cause errors at 40G or 100G.
Visual Connector Inspection
Dirty or damaged connectors are a leading cause of fiber network problems. Visual inspection using a fiber microscope identifies contamination, scratches, chips, and other defects that affect performance. This simple test often catches issues that would otherwise require extensive troubleshooting to locate.
Who Needs Fiber Characterization?
Any organization that owns, operates, or depends on fiber optic infrastructure benefits from characterization testing.
- Telecommunications carriers use fiber characterization to validate new construction, prepare for capacity upgrades, and maintain service quality across their networks.
- Data center operators rely on characterization to certify cabling installations and ensure links can support high-speed interconnects.
- Utilities with fiber-based communications for grid management need characterization to maintain reliable operations.
- Enterprises with campus fiber networks use characterization to document infrastructure and plan technology refreshes.
- Government and educational institutions depend on characterization to verify contractor work and maintain network documentation.
The Business Case for Proactive Testing
Reactive maintenance is expensive. Emergency repairs cost three to five times more than scheduled maintenance when factoring in overtime labor, expedited parts, and service credits for outages. Preventative maintenance programs that include regular fiber characterization typically cost 15 to 30 percent of reactive maintenance budgets while delivering superior reliability. Organizations that implement systematic testing and inspection report 20 to 50 percent reductions in downtime and 30 to 40 percent lower overall maintenance costs.
The math is compelling. If a single major outage costs $300,000 or more, preventing even one incident per year justifies significant investment in proactive testing and maintenance. Beyond cost avoidance, fiber characterization supports better planning. Accurate documentation of fiber performance enables confident capacity planning. Engineers can design upgrades knowing exactly what the installed infrastructure can support.
What to Expect from Professional Fiber Characterization Services
Professional fiber characterization services follow a structured process:
- Pre-test planning identifies the scope of work, access requirements, and specific tests needed based on the network type and intended applications.
- Field testing uses calibrated equipment operated by trained technicians. For comprehensive characterization, this includes bidirectional OTDR testing, loss measurements, and dispersion analysis where required.
- Documentation delivers detailed reports with test results, trace files, and analysis. This documentation becomes part of the permanent network record.
- Recommendations identify any issues found and suggest remediation steps. This might include cleaning connectors, re-splicing problem joints, or replacing damaged cable sections.
- The best characterization services integrate with broader infrastructure management. Test results feed into asset databases and maintenance planning systems.
Getting Started with Fiber Characterization
Organizations new to fiber characterization should start with a baseline assessment of their most critical routes. This establishes reference data for future comparison and often reveals issues that have gone undetected. For new construction or major upgrades, characterization should be part of the acceptance testing process. Verify that installed fiber meets specifications before signing off on contractor work. Ongoing maintenance programs should include periodic re-testing of critical routes. Comparing current results to baseline data reveals gradual degradation before it causes problems. Working with an experienced infrastructure partner simplifies the process. Look for providers with certified technicians, calibrated equipment, and a track record in telecommunications infrastructure.
Protect Your Network Investment
Fiber optic infrastructure represents a significant capital investment. Characterization testing protects that investment by ensuring the network performs as designed and identifying problems before they cause costly outages. The telecommunications industry continues to demand more bandwidth, lower latency, and higher reliability. Networks that cannot meet these demands will fall behind. Fiber characterization provides the visibility needed to keep infrastructure ahead of requirements.
Whether planning an upgrade, troubleshooting performance issues, or simply documenting what you have, fiber characterization delivers the answers. The question is not whether your network needs this testing. The question is how soon you can get started.
Fiber characterization gives network owners the performance data and documentation needed to prevent failures, plan upgrades, and protect the long-term value of their infrastructure. Contact Celerity Integrated Services to discuss how its certified testing, fiber auditing, troubleshooting, and infrastructure expertise can help identify hidden issues and keep your network prepared for growing bandwidth and reliability demands.